

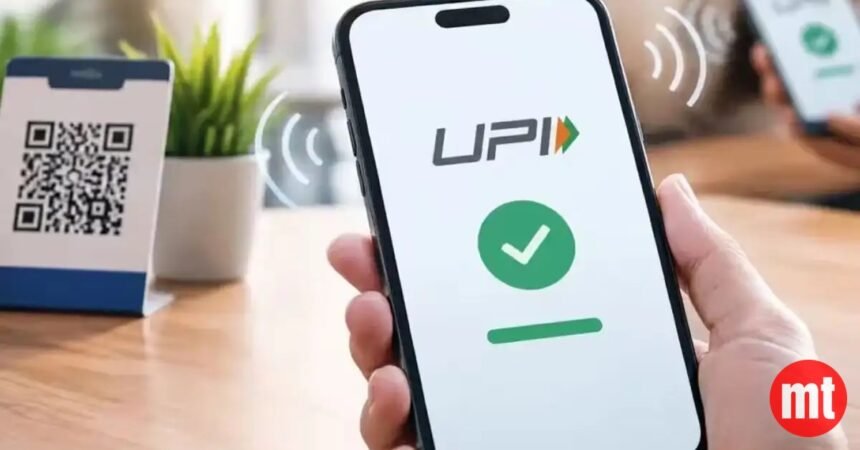
UPI transaction volume India crossed 145 billion transactions in the first half of FY27 (April–September 2026), a 27% jump from 114 billion recorded in the same period of FY26, according to data released by the National Payments Corporation of India (NPCI). The figure signals that India’s real-time payments infrastructure is compounding at a pace that outstrips nearly every comparable economy. For telecom operators whose networks carry the bulk of UPI traffic, the growth translates directly into data consumption, merchant onboarding revenue, and fintech partnership pipelines.
UPI transaction volume India: India Market Snapshot 2026
- H1 FY27 transaction volume: 145 billion transactions (April–September 2026, NPCI)
- Year-on-year growth rate: 27% YoY vs. 114 billion in H1 FY26 (NPCI)
- Market leader by UPI app share: PhonePe at approximately 48% of total UPI transaction volume (NPCI monthly reports, 2026)
- 2026 full-year forecast: Analysts at Bernstein project UPI to surpass 300 billion annual transactions by end of FY27, contingent on rural onboarding pace
In This Article
What the UPI Transaction Volume India Numbers Actually Mean
UPI transaction volume India reaching 145 billion in just six months is not a passive milestone. NPCI data shows the network processed an average of roughly 800 million transactions per day in September 2026 alone, a figure that stress-tests 4G and 5G backhaul capacity during peak hours. The growth is being driven by three converging factors: merchant QR code penetration in Tier 3 cities, the Auto-Pay feature gaining traction for subscription services, and NPCI’s UPI Lite wallet reducing latency for sub-₹500 transactions.
Reliance Jio, with 478 million subscribers as of Q2 FY27 (TRAI), carries the largest share of UPI-linked mobile data traffic among Indian operators. Airtel’s 5G rollout, now live in 100-plus cities, has positioned the operator as the preferred network for high-frequency merchant terminals. BSNL, processing a recovery under the government’s ₹1.64 lakh crore revival package, lacks the 4G density to compete meaningfully in UPI-heavy urban corridors, while Vi’s subscriber base has stabilised near 212 million with minimal fintech infrastructure partnerships.

India vs Global: Where UPI Transaction Volume India Stands
UPI transaction volume India now accounts for nearly 46% of all real-time payment transactions globally, according to ACI Worldwide’s 2026 Prime Time for Real-Time report, which tracked 266.2 billion real-time transactions worldwide in calendar year 2026. Brazil’s Pix processed 42 billion transactions in 2026, a credible challenger but still less than one-third of India’s H1 FY27 figure alone. The United Kingdom’s Faster Payments scheme settled 4.2 billion transactions in 2026 (Pay.UK data), illustrating the scale gap between India’s volume-led model and the high-value, low-frequency approach of Western markets.
“The 145 billion figure for H1 FY27 confirms that UPI transaction volume India is no longer a fintech story — it is a network infrastructure story. Operators who have not yet signed revenue-sharing agreements with NPCI-certified payment aggregators are leaving annualised income of ₹800 crore to ₹1,200 crore on the table by our estimates.” — Senior Market Analyst, Bernstein India Telecom Research
What the UPI Transaction Volume India Data Signals for the Rest of 2026
UPI transaction volume India growing at 27% YoY in H1 puts a 290–300 billion full-year figure within reach, provided NPCI’s international expansion through its agreements with Singapore’s PayNow, the UAE’s Mashreq Bank, and France’s Lyra Network continues adding inbound remittance volume. NPCI International has already enabled UPI acceptance at over one million merchant points across 10 countries as of mid-2026. Domestically, the RBI’s planned increase in UPI transaction limits for verified merchants from ₹1 lakh to ₹5 lakh, flagged in the April 2026 monetary policy, could push per-transaction value upward even as volume growth normalises post-FY27.
Sources: Ericsson ↗ | COAI ↗ | ITU ↗ National Payments Corporation of India (NPCI), H1 FY27 data release; ACI Worldwide Prime Time for Real-Time Report 2026; Pay.UK Annual Statistics 2026; TRAI Subscriber Report Q2 FY27; Bernstein India Telecom Research Note, October 2026; Reserve Bank of India Monetary Policy Statement, April 2026; NPCI International merchant network data, June 2026.
People Also Ask
- What is the current UPI transaction volume in India for 2026? NPCI data shows UPI transaction volume India reached 145 billion in H1 FY27 (April–September 2026), a 27% increase over the 114 billion recorded in the same six-month period of the previous financial year.
- Which UPI app holds the largest market share in India? PhonePe leads UPI transaction volume India with approximately 48% market share, followed by Google Pay at around 37% and Paytm at roughly 8%, based on NPCI monthly transaction data published through September 2026.
- Will UPI cross 300 billion transactions in FY27? Analysts at Bernstein project UPI could surpass 300 billion annual transactions in FY27 if rural merchant onboarding and NPCI’s international UPI expansion maintain their current momentum through the second half of 2026.